B) False
Correct Answer

verified
Correct Answer
verified
Multiple Choice
The benefit that government receives from a tax is measured by
A) deadweight loss.
B) consumer surplus.
C) tax incidence.
D) tax revenue.
F) A) and B)
Correct Answer

verified
Correct Answer
verified
Multiple Choice
Assume the price of gasoline is $2.00 per gallon, and the equilibrium quantity of gasoline is 10 million gallons per day with no tax on gasoline. Starting from this initial situation, which of the following scenarios would result in the largest deadweight loss?
A) The price elasticity of demand for gasoline is 0.1; the price elasticity of supply for gasoline is 0.6; and the gasoline tax amounts to $0.20 per gallon.
B) The price elasticity of demand for gasoline is 0.1; the price elasticity of supply for gasoline is 0.4; and the gasoline tax amounts to $0.20 per gallon.
C) The price elasticity of demand for gasoline is 0.2; the price elasticity of supply for gasoline is 0.6; and the gasoline tax amounts to $0.30 per gallon.
D) There is insufficient information to make this determination.
F) A) and C)
Correct Answer

verified
Correct Answer
verified
Multiple Choice
Figure 8-23. The figure represents the relationship between the size of a tax and the tax revenue raised by that tax. 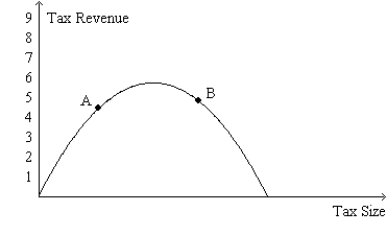 -Refer to Figure 8-23. The curve that is shown on the figure is called the
A) deadweight-loss curve.
B) tax-incidence curve.
C) Laffer curve.
D) Lorenz curve.
F) A) and C)
Correct Answer

verified
Correct Answer
verified
Multiple Choice
Scenario 8-1 Erin would be willing to pay as much as $100 per week to have her house cleaned. Ernesto's opportunity cost of cleaning Erin's house is $70 per week. -Refer to Scenario 8-1. If Ernesto cleans Erin's house for $90, Ernesto's producer surplus is
A) $80.
B) $30.
C) $20.
D) $10.
F) A) and C)
Correct Answer

verified
Correct Answer
verified
True/False
The demand for bread is less elastic than the demand for donuts; hence, a tax on bread will create a larger deadweight loss than will the same tax on donuts, other things equal.
B) False
Correct Answer

verified
Correct Answer
verified
Multiple Choice
Figure 8-12  -Refer to Figure 8-12. Suppose a $3 per-unit tax is placed on this good. The loss of producer surplus resulting from this tax is
A) $5.50.
B) $17.50.
C) $22.50.
D) $45.00
F) A) and D)
Correct Answer

verified
Correct Answer
verified
Multiple Choice
When motorcycles are taxed and sellers of motorcycles are required to pay the tax to the government,
A) the quantity of motorcycles bought and sold in the market is reduced.
B) the price paid by buyers of motorcycles decreases.
C) the demand for motorcycles decreases.
D) there is a movement downward and to the right along the demand curve for motorcycles.
F) A) and D)
Correct Answer

verified
Correct Answer
verified
Multiple Choice
Figure 8-23. The figure represents the relationship between the size of a tax and the tax revenue raised by that tax.  -Refer to Figure 8-23. If the economy is at point B on the curve, then an increase in the tax rate will
A) increase the deadweight loss of the tax and increase tax revenue.
B) increase the deadweight loss of the tax and decrease tax revenue.
C) decrease the deadweight loss of the tax and increase tax revenue.
D) decrease the deadweight loss of the tax and decrease tax revenue.
F) B) and D)
Correct Answer

verified
Correct Answer
verified
Multiple Choice
Figure 8-7
The vertical distance between points A and B represents a tax in the market. 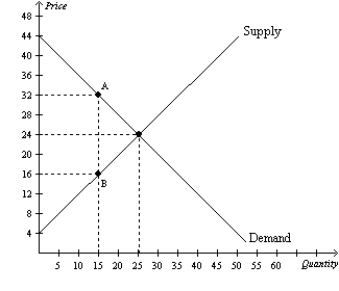 -Refer to Figure 8-7. Which of the following statements is correct?
A) The loss of producer surplus that is associated with some sellers dropping out of the market as a result of the tax is $60.
B) The loss of consumer surplus for those buyers of the good who continue to buy it after the tax is imposed is $120.
C) The loss of consumer surplus caused by this tax exceeds the loss of producer surplus caused by this tax.
D) This tax produces $320 in tax revenue for the government.
F) All of the above
Correct Answer

verified
Correct Answer
verified
True/False
The Laffer curve illustrates how taxes in markets with greater elasticities of demand compare to taxes in markets with smaller elasticities of supply.
B) False
Correct Answer

verified
Correct Answer
verified
Multiple Choice
Figure 8-4
The vertical distance between points A and B represents a tax in the market. 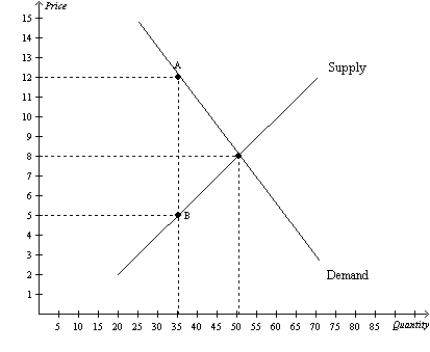 -Refer to Figure 8-4. The equilibrium price before the tax is imposed is
A) $12, and the equilibrium quantity is 35.
B) $8, and the equilibrium quantity is 50.
C) $5, and the equilibrium quantity is 35.
D) $5, and the equilibrium quantity is 50.
F) A) and B)
Correct Answer

verified
Correct Answer
verified
Multiple Choice
In 2012, in The Wall Street Journal, economists Edward Prescott and Lee Ohanian asserted that
A) in the United States, when the average worker earns $100 from additional work, he or she will be able to consume an additional $85 worth of goods and services.
B) the typical American has always worked more hours per year than the typical Frenchman and the typical German, despite vastly different tax rates in those countries.
C) raising tax rates from their 2012 levels would significantly reduce U.S. economic activity.
D) raising tax rates from their 2012 levels would significantly increase the federal government's tax revenue.
F) A) and C)
Correct Answer

verified
Correct Answer
verified
Multiple Choice
Figure 8-12  -Refer to Figure 8-12. Suppose a $3 per-unit tax is placed on this good. The per-unit burden of the tax on buyers is
A) $1.
B) $2.
C) $3.
D) $4.
F) C) and D)
Correct Answer

verified
Correct Answer
verified
Multiple Choice
Figure 8-12  -Refer to Figure 8-12. Suppose a $3 per-unit tax is placed on this good. The per-unit burden of the tax on sellers is
A) $1.
B) $2.
C) $3.
D) $4.
F) C) and D)
Correct Answer

verified
Correct Answer
verified
Multiple Choice
Figure 8-2
The vertical distance between points A and B represents a tax in the market. 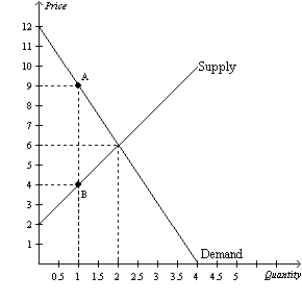 -Refer to Figure 8-2. The per-unit burden of the tax on sellers is
A) $2.
B) $3.
C) $4.
D) $5.
F) C) and D)
Correct Answer

verified
Correct Answer
verified
Multiple Choice
Taxes cause deadweight losses because they
A) lead to losses in surplus for consumers and for producers that, when taken together, exceed tax revenue collected by the government.
B) distort incentives to both buyers and sellers.
C) prevent buyers and sellers from realizing some of the gains from trade.
D) All of the above are correct.
F) B) and C)
Correct Answer

verified
Correct Answer
verified
Multiple Choice
Figure 8-10 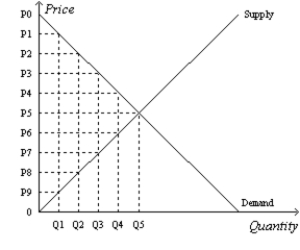 -Refer to Figure 8-10. Suppose the government imposes a tax that reduces the quantity sold in the market after the tax to Q2. With the tax, the consumer surplus is
A) (P0-P2) x Q2.
B) 1/2 x (P0-P2) x Q2.
C) (P0-P5) x Q5.
D) 1/2 x (P0-P5) x Q5.
F) A) and C)
Correct Answer

verified
Correct Answer
verified
Multiple Choice
Figure 8-8
Suppose the government imposes a $10 per unit tax on a good. 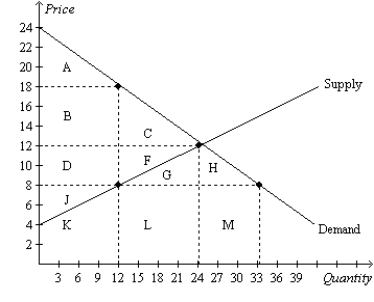 -Refer to Figure 8-8. One effect of the tax is to
A) reduce consumer surplus by $108.
B) reduce producer surplus by $72.
C) create a deadweight loss of $60.
D) All of the above are correct.
F) A) and B)
Correct Answer

verified
Correct Answer
verified
Multiple Choice
Assume that for good X the supply curve for a good is a typical, upward-sloping straight line, and the demand curve is a typical downward-sloping straight line. If the good is taxed, and the tax is doubled, the
A) base of the triangle that represents the deadweight loss quadruples.
B) height of the triangle that represents the deadweight loss doubles.
C) deadweight loss of the tax doubles.
D) All of the above are correct.
F) B) and D)
Correct Answer

verified
Correct Answer
verified
Showing 121 - 140 of 513
Related Exams